What does CNC health mean to me for this machine?
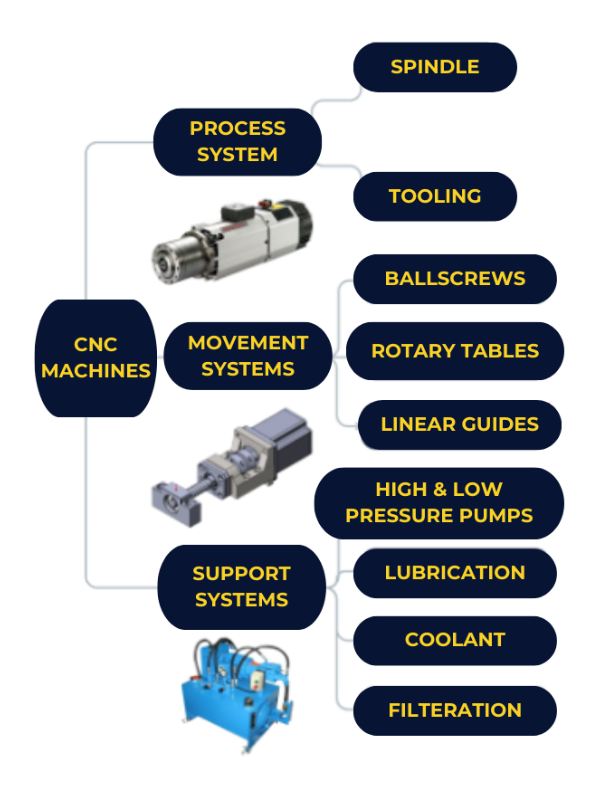
With the challenge, however, comes an enormous selection of value. KCF’s data platform, SMARTDiagnostics, is capable of integrating data from a diverse array of sensors—vibration, pressure/flow, speed, oil temperature, ferrous/non ferrous materials, and many other sensors with either an analog or IEPE output. Together, all of the sensors combine to form a comprehensive machine health platform with an arsenal of data to solve a complex array of potential issues on a CNC machine. Figure 2 on the right shows a breakdown of some of the critical systems to attack.
The Value
Predictive Maintenance | Extended Equipment Life | Operational Efficiency | Quality Assurance | Tool Life Optimization | Power Monitoring | Data-Driven Insights | Safety Enhancements | Condition-Based Maintenance
CNC Monitoring | Data Collection
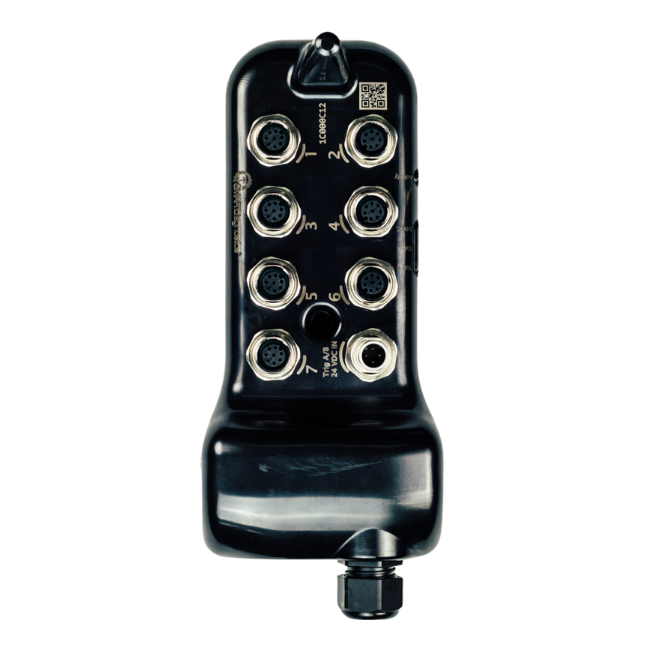
The IoT HUB Monitors:
*adapters necessary for monitoring
Oil Humidity | Current Signature | PLC Trigger | Tachometer | Pressure Signature | Ultrasonic Sensing | Voltage | Motor Current Signature Analysis (MCSA) | Temperature | Speed | Flow
The HUB is permanently powered by 24VDC Power Supply Triggering (A/B) or 220VAC. This enables monitoring is applications where battery replacements are a hurdle.

Timed Vibration Readings
With most wireless vibration sensors, the readings are collected on a time interval independent to each sensor. This means that from one reading to the next, you may catch the crane when it is off, as it is ramping up, or when it is under full load. The variability of time-based readings can be observed in the trendline above and can often trigger false alarms.
Triggered Vibration Readings
To overcome this fundamental issue, readings need to be taken not based on time, but on the machine’s operating state. In addition to this, it is essential to identify what state of operation will provide the best representation of the health of each component of the crane. Once identified, triggered vibration readings enable the user to continually record readings that create a trendline representing the crane’s health as seen above.
The following examples come from real CNC deployments amongst KCF’s customer base. These are two different fault modes that could have had severe potential consequences had they not been addressed. The data from these crane deployments enabled fast action by the customer to mitigate the issues before they could produce any downtime.
Y-Axis Ballscrew – Peak Acceleration
The data presented in the two graphs above illustrates a low escalation in vibration detected in the Y-Axis ballscrew of a CNC machine. The first graph provides a visualization of the general vibration trend over time, while the second graph offers a detailed view of the frequency spectrum for the ballscrew. Although the vibration magnitude increment—from 0.4g to 1.5g— is within a low range, a closer inspection of the frequency spectrum reveals a pronounced spike in a particular frequency band, signaling a potential anomaly warranting immediate investigation given the criticality of the asset to equipment function and to the site.
CNC Gearbox Health Timeline
At the end of February of 2023, this customer received an alert on the Y-Axis ballscrew for high peak acceleration. Without full spectrum data, this customer would have needed to manually investigate the ballscrew for an issue or wear (not an easy inspection!).
However, KCF’s SENTRY service quickly identified that the vibration signature belonged to a gear. With the Y-Axis ballscrew being located alongside the main gearbox that drove the spindle, it was quickly identified that the true source of the problem was the gearbox. Two weeks later, the customer received a notification that there was now high vibration on the gearbox, confirming the problem. In early April, the gearbox reached the end of its life.
Milling Spindle Motor Vibration
Milling Spindle Frequency Spectrum
In the first graph, you can see peak acceleration increase on the spindle servo driving the tool. Although the overall trend is choppy, the frequency spectrum comes through crystal clear. The site performed a visual inspection shortly after they were notified of the issue and were able to take corrective action and replace the tool before any blocks failed quality inspection. Once the frequency band was identified and labeled, SMARTDiagnostics could trend the amplitude of just that specific frequency band as “tool health”. Now, instead of needing to analyze data everytime an increase is observed, an automated warning can be generated each time the tool begins to show signs of deteroration.


