
Want to eliminate unplanned downtime and extend the lifespan of your critical assets?
Contact us to see how our comprehensive, AI-driven predictive maintenance platform can optimize your operations.
View Case Study: How US Farathane Turned Predictive Maintenance Into a Competitive Advantage 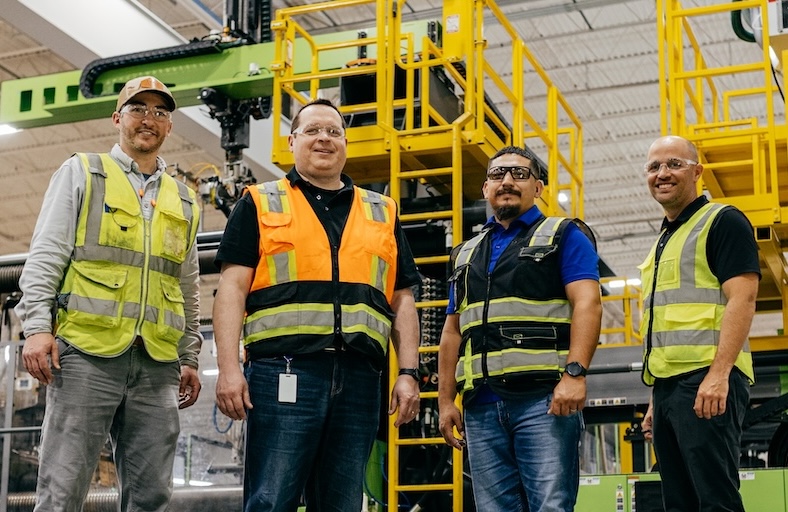
How US Farathane Turned Predictive Maintenance Into a Competitive Advantage
Learn how US Farathane used predictive maintenance to identify equipment issues earlier, reduce downtime, and transform its maintenance team into proactive reliability leaders.